|
|
Hi-C Unifying Genomic InterrogatorHUGIn is designed to explore chromatin organizations across multiple human cell lines and primary tissues. User TutorialFor questions or comments about HUGIn, please contact jsmartin at email.unc.edu. |
User Interface
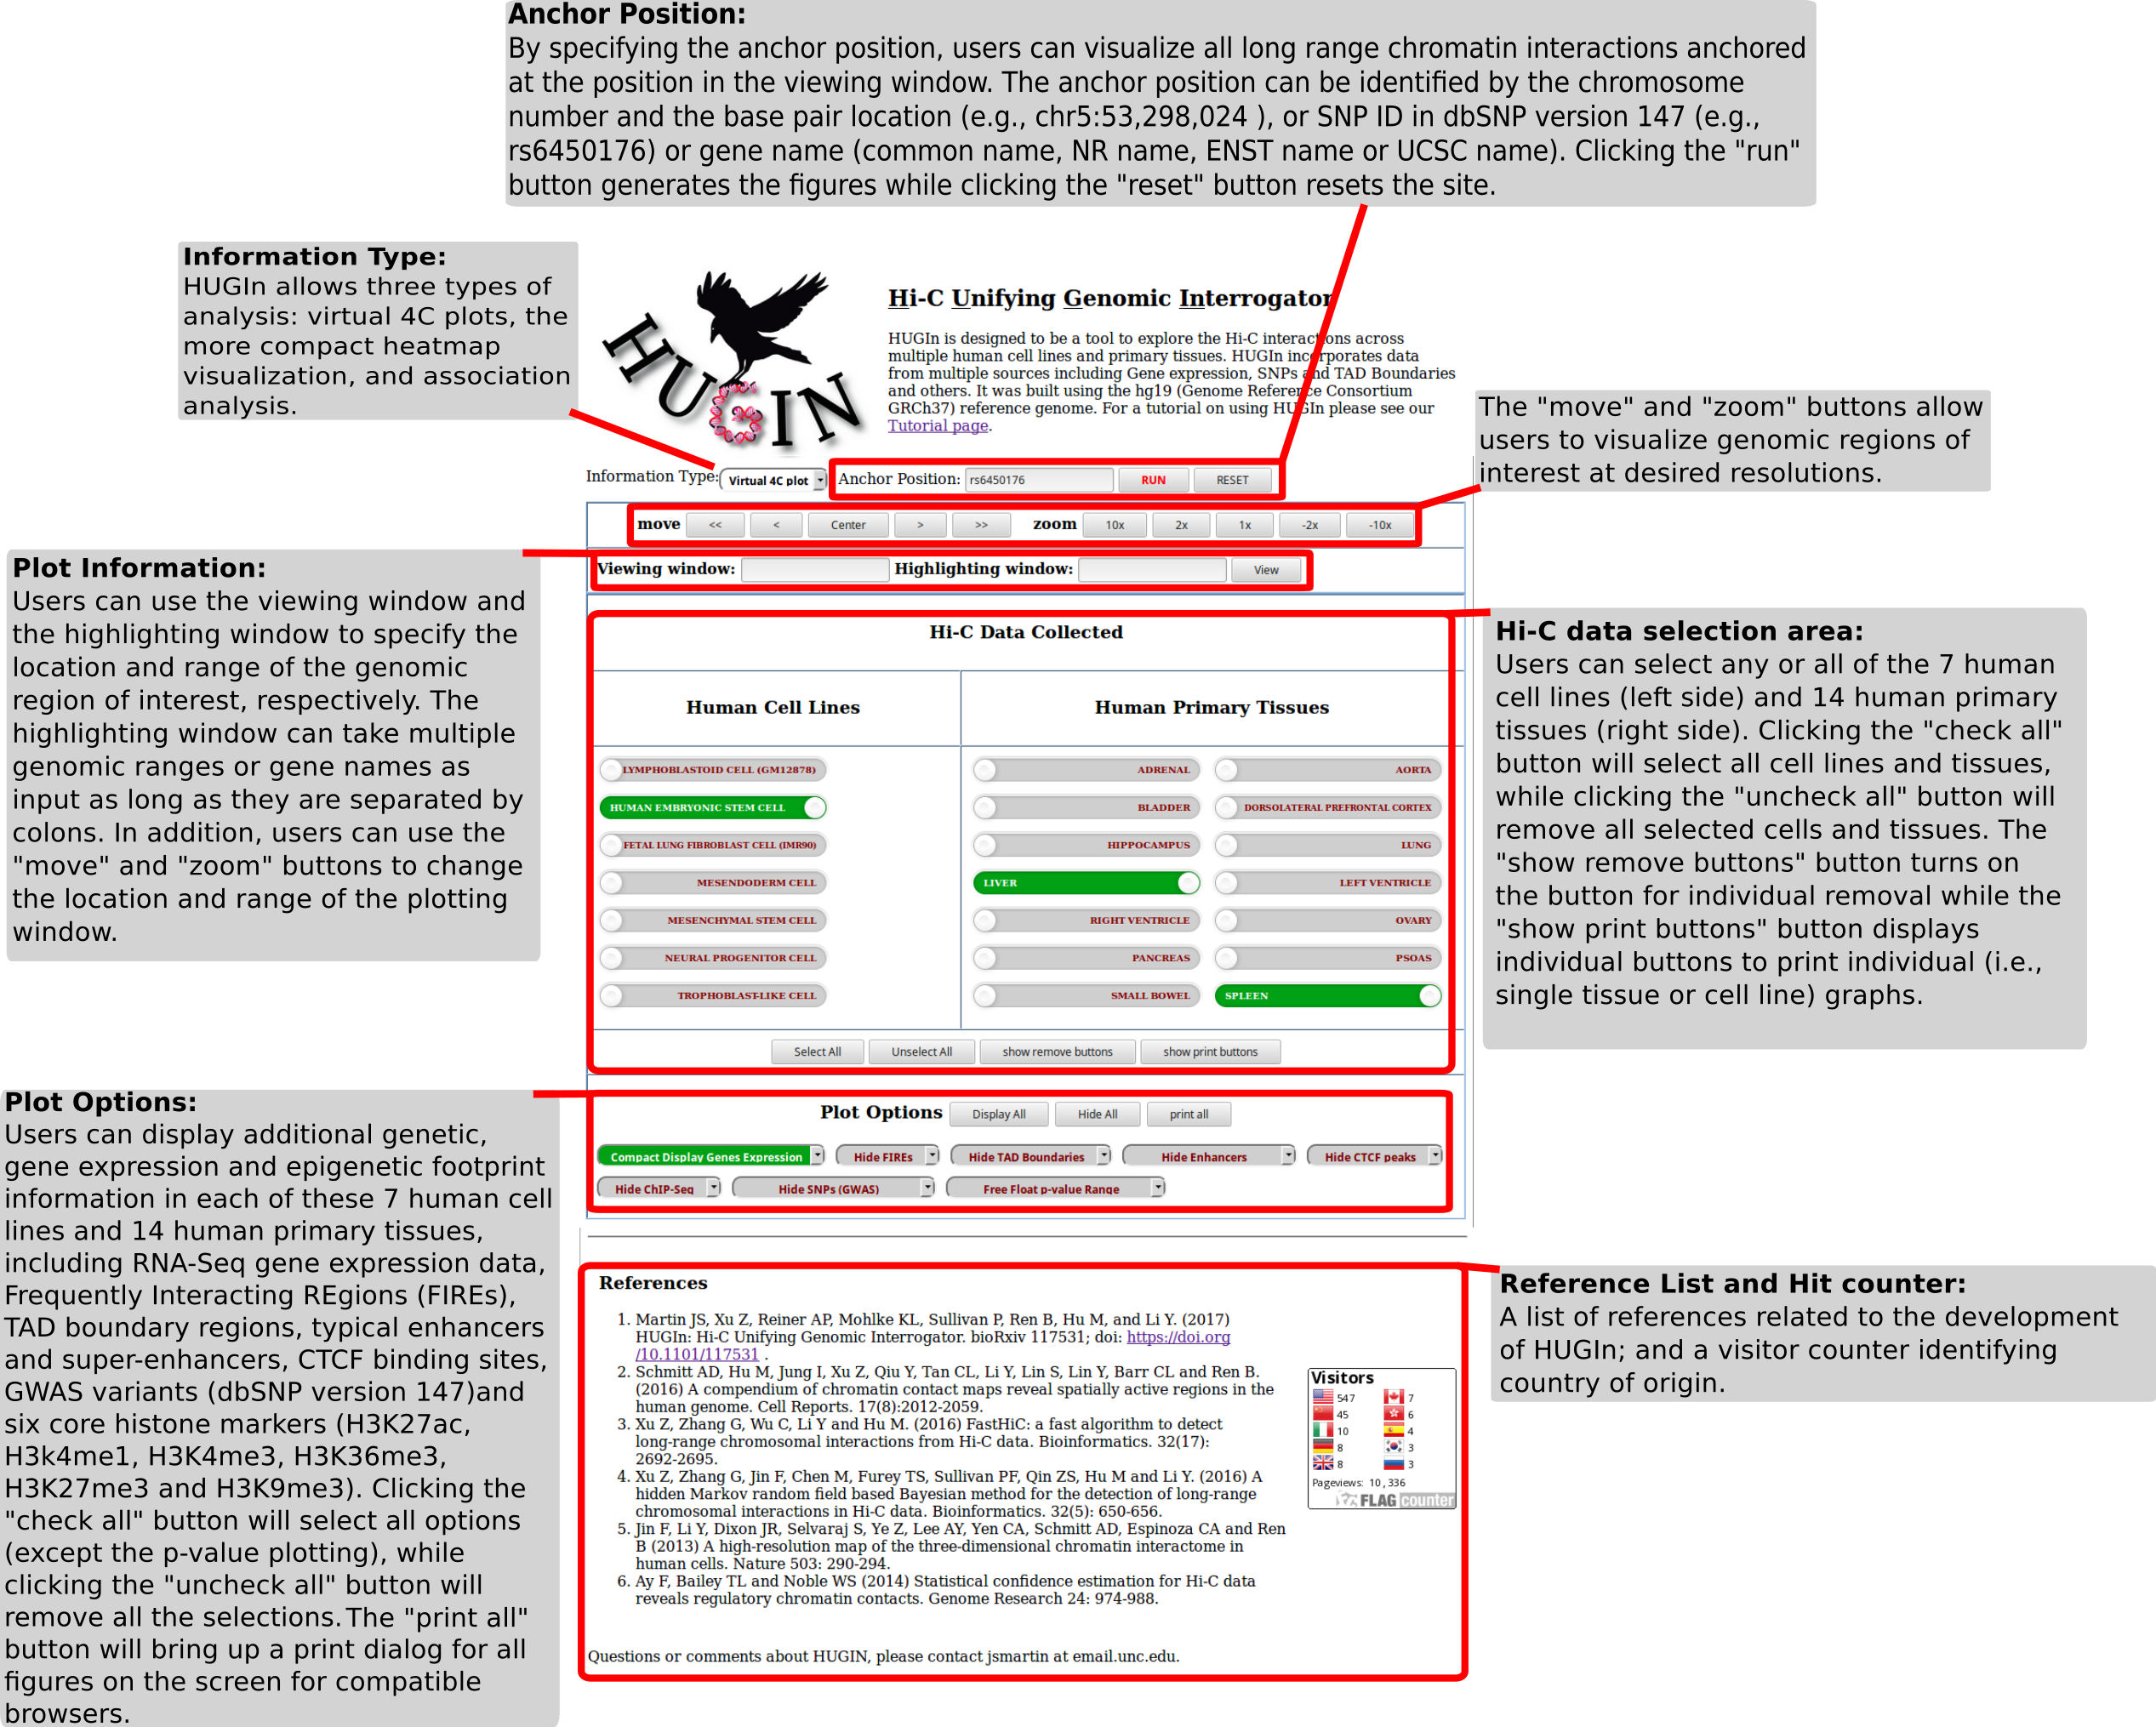
HUGIn hosts a compendium of Hi-C data (Schmitt et al., 2016) mapped to the human reference genome hg19. The main interface of HUGIn consists of the following four major sections (Figure 1 below). The first section is the “Anchor Position”, which defines the anchor of long range chromatin interactions. In the GWAS context, this Anchor Position is mostly defined by a SNP ID. By default, this Anchor Position is set to chr5:53,298,025, which is the position of SNP rs6450176, associated with type 2 diabetes status and adiponectin level. Accepted Anchor Position includes SNP names in rs nomenclature (dbSNP version 147), chr:bp (e.g., the default chr5:53,298,025), and multiple gene IDs including the common name, RefSeq gene name, ensemble ID, and UCSC gene name. After typing in the Anchor Position, users can click the “RUN” button (in red) to generate the virtual 4C plot (by default), as well as a more compact heatmap plot (available when clicking on the Information Type box). For both plots, the bin containing the Anchor Position is highlighted in gray. Internally, HUGIn identifies the 40Kb bin containing the Anchor Position user specifies. Note that 40Kb is the resolution of the Hi-C data for the 7 cell lines and 14 primary tissues generated by Schmitt et al 2016. Given the experimental protocol (for example, using 4 base pair or 6 base pair restriction enzyme) and typical sequencing depth of Hi-C experiments (for example, Schmitt et al generated an average of ~214 million raw reads per tissue, and an average of ~809 million raw reads per cell line), we cannot achieve the base pair resolution of chromatin interactions. The primary goal of HUGIn is to identify the target gene(s) of SNP(s) or region(s) of interest, as in contrast to pinpointing THE causal SNP(s).
The second section includes the “move” and “zoom” buttons, which allow users to visualize genomic regions of interest at desired resolutions. Specially, the arrow buttons control which direction the viewing window moves. Clicking the one arrow (“<” and “>”) buttons moves the window 10% in the specified direction, while clicking the double arrow (“<<” and “>>”) buttons moves the window 25% in the specified direction. The zoom buttons control the range of the viewing window. For example, clicking “2x” button reduces the viewing window to half of the current range, while clicking “-10x” button increases the viewing window to ten times of the current range. In addition, users can directly input the genomic region of interest in the “viewing window” text box, and highlight any part of such genomic region using the “highlighting window” text box. The segment in the “highlighting window” is highlighted in yellow.
The third section lists the sample names of the Hi-C compendium data, including 7 human cell lines in the left panel and 14 human primary tissues in the right panel. Users can select any subset of these 21 samples to visualize both cell line/tissue-shared and cell line/tissue-specific long range chromatin interactions. By default, HUGIn adopts the virtual 4C plot for visualization. Specifically, a virtual 4C plot displays the observed and expected read counts, and the statistical significance, in –log10(P-value), of each long range chromatin interaction within a 2Mb genomic distance centered at the Anchor Position. In the virtual 4C plot, three lines are color coded: the black line represents the observed count; the red line represents the expected counts; and the blue line represents the –log10(P-value). The scale of the counts (both observed and expected) is labeled on the left Y-axis; while the scale of the –log10(P-value) is labeled on the right Y-axis. The genomic location of each base pair is annotated along the X-axis. Examples are shown in Figure 2 below. In addition, HUGIn also provides a more compacted heatmap visualization. In a heatmap, the size of each dot represents the ratio between the observed and expected read counts. The darkness of the red color represents the statistical significance of each long range chromatin interaction.
The fourth section includes a comprehensive collection of genetic and epigenetic data in the corresponding cell lines or tissues. Specifically, users can visualize RNA-Seq gene expression data, frequently interacting regions (FIREs), boundaries of topologically associating domains (TADs), typical enhancers and super-enhancers, CTCF binding sites, three core histone markers (H3kme1,H3k4me3 and H3k27ac) and GWAS variants (dbSNP version 147). We will soon add three additional core histone markers (H3K36me3, H3K27me3 and H3K9me3) in the related cell lines or tissues.
Explanation of Generated Figures
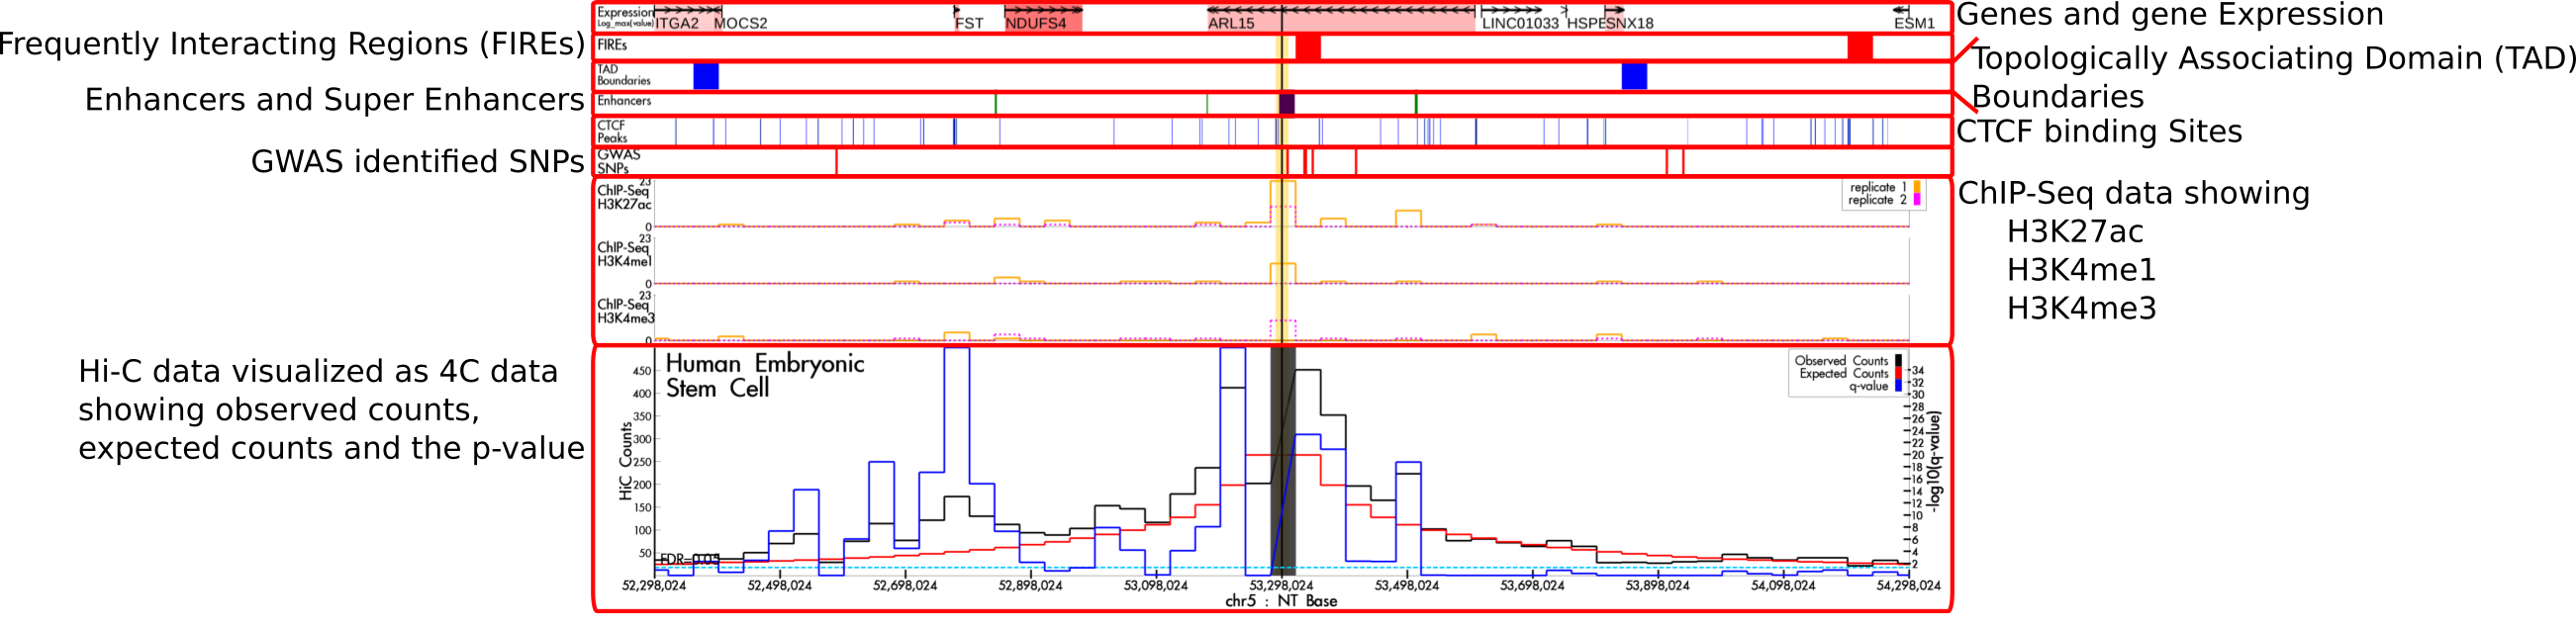
HUGIn is designed to explore chromatin organizations across multiple human cell lines and primary tissues. HUGIn incorporates data from multiple sources but with a focus on long-range chromatin interactions from the analysis of Hi-C data. The Hi-C data are normally plotted as a virtual 4C plot with a given anchor position. This data are always shown as the Figure 2 below. This figure consists of three lines, the observed counts (black line), the expected counts (red line) and -log10(p-value) line (blue line). The range of the -log10(p-value) is plotted on the y-axis on the right side while the range of the count data is shown on the left. The anchor point is indicated as a thick black vertical bar and the bin containing the anchor point is shaded in grey. Different genes or regions can be highlighted in yellow as indicated by the highlighting window in the Plot Information area. All other information types can be turned on in the Plot Options area.
By default, the positions and expression levels of genes are plotted. Each gene is indicated by an arrow pointing the direction of transcription. The start site is indicated by the tail of the arrow. Each gene is labeled by its common name and highlighted in red indicating the expression level: the deeper the red color the higher the expression. Below the gene expression in the example output, Frequently Interacting regions (FIREs) are plotted as bands of red indicating areas that have been identified as frequently interacting with neighborhood. The Topologically Associating Domain (TAD) Boundaries are shown in blue blocks. In the example, below the TAD boundaries is the Enhancers - typical enhancers are plotted in green while super enhancers are plotted in purple. Below the enhancers are the binding sites for the CTCF protein which has been shown to bind together strands of DNA to form loops and are indicated by blue vertical lines. The red vertical lines below the CTCF binding sites show positions of SNPs identified in genome wide association studies (GWAS). ChIP-Seq data, examine modifications of the DNA packaging protein Histone H3. Currently, HUGIn shows two replicates of identified peaks within 40kb bins for H3K27ac, H3K4me1 and H3K4me3.
All but the Hi-C data can be hidden through the dropdown selectors in the Plot Options area. Gene expression, enhancers and SNPs have multiple plotting options (e.g., compact or expanded display).
Extracting Figures
The best way to export the HUGIn images is to use either the print all button in Plot Options, or to turn on and use the individual print buttons to print the images to files. This requires printing the images to a pdf file. Not all browsers and operating systems are compatible with this method. An alternative and most general method is to right click and select “save image as” to download the generated png images. The resulting file can then be manipulated as a standard png file. The resulting images, print via the print buttons or downloaded as a png, will have a resolution of 600 dpi when scaled to 8in across. This is twice the recommended resolution (300 dpi) for most journals.
FAQs
If I use any graphs or the data generated from HUGIn, who should I cite?
All the data originates from:
with the expected counts and p-values generated using Fit-Hi-C:
The paper to cite for figures created by HUGIn is:
Please site all three papers when using HUGIn generated graphs or information.
Who should I contact if I have a question or feature request?
Please send all requested features or questions to jsmartin at email.unc.edu.
Why HUGIn?
HUGIn stands for Hi-C Unifying Genomic Interrogator; however, the name Hugin originates from Norse mythology. The story goe1s that Odin would send his two ravens, Huginn and Muninn (sometimes spelled Hugin and Munin), all over the world to bring him information. In old Norse Huginn means "thought." For these reasons we felt Hugin was a good moniker for this web tool.
Why the raven imagery in the logo?
One of the insperations for the name Hugin was from Nordic mythology, specifically the name of one of Odin's ravens. Odin would send the ravens out every day to gather information from around the world and bring it back to him. The raven imagery is present to make this connection to this Nordic mythology.