HMRFBayesHiC: A Hidden Markov Random Field Based Bayesian Method For the Detection of Long-range Chromosomal Interactions in Hi-C Data
What You Need
Installation
After downloading the HMRFBayesHiC_All.zip into a chosen local folder "local_path",-
1. Unzip the file HMRFBayesHiC_All.zip, you will get a R package HMRFBayesHiC_1.0.tar.gz, a PDF manuscript HMRFBayesHiC.pdf and a folder "example" including toy data as the file toyHiC_frag15060_15069.txt.
2. Start R envrionment and set "local_path" as your working directory by using R function setwd.
3. Use R command
install.packages("HMRFBayesHiC_1.0.tar.gz", repos = NULL, type="source")
to install HMRFBayesHiC.
4. Use R command library("HMRFBayesHiC") to load HMRFBayesHiC.
How to Run
In R package of HMRFBayesHiC, the function HiC_HMRF_Bayes_File is the main function to conduct HMRF-Bayes peak calling. It conducts three steps (1) HiC data loading via R function HiC_Prepare_Matrix, (2) peak calling via the function HiC_HMRF_Bayes and (3) HiC results outputting via the function HiC_Output.
Usage of HiC_HMRF_Bayes_File
- HiC_HMRF_Bayes_File(file,probfile,estimatorfile, sep="\t",header=TRUE, verbose=TRUE, burnIn = 5000, iter = 5000)
Input of HiC_HMRF_Bayes_File
- file: the HiC data file for HiC_HMRF_Bayes_Files load, which is a text file, with 4 columns respectively as fragment 1 number, fragment 2 number, observed frequency and expected frequency.
- probfile: the HiC result file for HiC_HMRF_Bayes_Files to output the estimated peak probability. The prob file is a text file with 5 columns respectively as fragment 1, fragment 2, observed frequencies, expected frequencies and peak probabilities.
- estimatorfile: the HiC result file for HiC_HMRF_Bayes_Files to output the values of estimated parameters theta, phi and psi in the model used in HiC-HMRF-Bayes method.
- sep: the field separator character, to specify the delimiter for HiC data file. By default, it is "\t".
- header: a logical value indicating whether the HiC data file contains the names of the variables as its first line. By default, it is true.
- verbose: a logical value controlling whether some information should be outputted. If it is true, the number of HiC records loaded will be reported in HiC data loading step and the values of estimated parameters in peak calling step will be reported in each 200 steps. By default, it is true.
- burnIn: the number of burn-ins in HiC HMRF_Bayes peak calling. By default, it is 5000. For example, if burnin=4000 and iter=8000, out HiC-HMRF-Bayes will run 12000 simulations.
- iter: the number of simulations after the burn-ins for the function HiC_HMRF_Bayes called internally. By default, it is 5000. For example, if burnin=4000 and iter=8000, out HiC-HMRF-Bayes will run 12000 simulations.
Results of calling HiC_HMRF_Bayes_File
After researchers call the function HiC_HMRF_Bayes_Files, two output files will be generated:
- The estimated peak probability will be written into the file specified by "probfile".
- The estimated parameters of phi,theta and psi will be written in to the file specified by "estimatorfile".
Example
- Download the toy data toyHiC_frag15060_15069.txt (Hi-C information for fragment 15060-15069 for combined 12 IMR90 cells in Jin et al (2014)'s science paper. Column 1-4 are fragment 1 number, fragment 2 number, observed frequency and expected frequency).
- Put the toy Hi-C data file toyHiC_frag15060_15069.txt in your R working directory, and then specify the HiC output file. Here, we specify the output file for peak probability as "toyHiC_frag15060_15069_Results.txt", and the output file for estimated parameters of theta, phi and psi as "toyHiC_frag15060_15069_Estimated_Parameters.txt". You just need to run the function
HiC_HMRF_Bayes_File(file="toyHiC_frag15060_15069.txt",
probfile="toyHiC_frag15060_15069_Results.txt",
estimatorfile="toyHiC_frag15060_15069_Estimated_Parameters.txt",
sep="\t",header=TRUE, verbose=TRUE, burnIn = 5000, iter = 5000) - Then you will find two HiC results files are generated in the R working directory, i.e. "toyHiC_frag15060_15069_Results.txt" and "toyHiC_frag15060_15069_Estimated_Parameters.txt" .
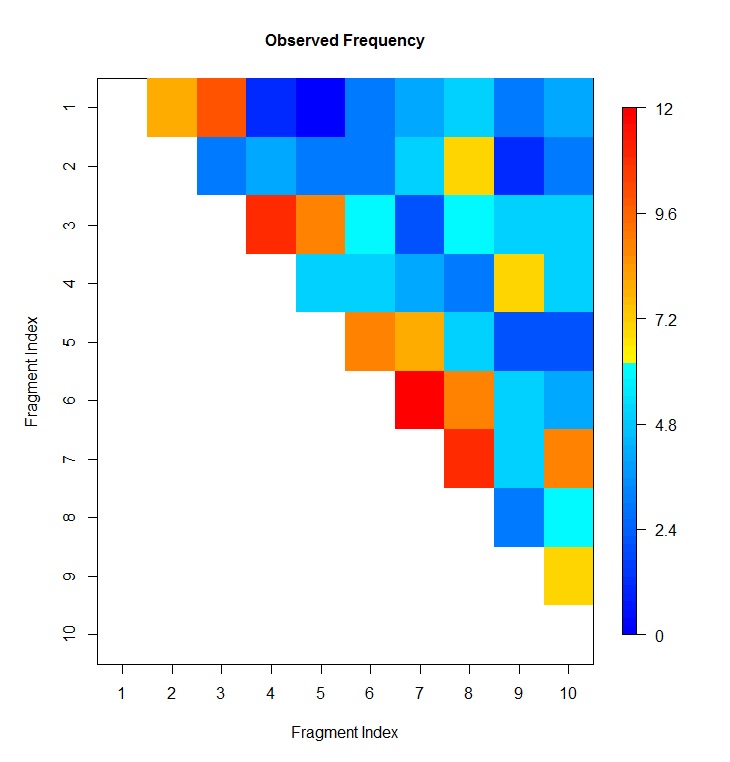
- You may plot heatmap of expected frequency, observed frequency and peak probability using our HiC_Plot_Heatmap utility function . Specify the input file name and column numbers for fragment 1, fragment 2 and the value to be plotted. See below
# plot heatmap of expected frequency, which is at column 3 of HiC data file
HiC_Plot_Heatmap(file="toyHiC_frag15060_15069.txt",index=c(1,2,3),
verbose=TRUE,sep="\t",header=TRUE,negative.log10.scale=FALSE,
xlab="Fragment Index",ylab="Fragment Index",
main="Observed Frequency",col=blue2red(100))
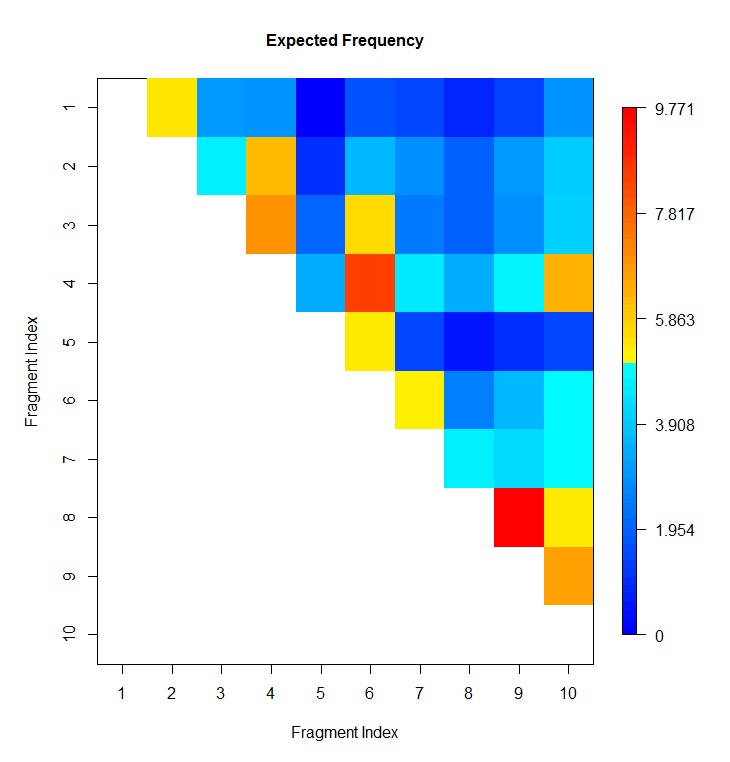
# plot heatmap of expected frequency, which is at column 4 of HiC data file
HiC_Plot_Heatmap(file="toyHiC_frag15060_15069.txt",index=c(1,2,4),
verbose=TRUE,sep="\t",header=TRUE,negative.log10.scale=FALSE,
xlab="Fragment Index",ylab="Fragment Index",
main="Observed Frequency",col=blue2red(100))
# plot heatmap of posterior, which is at column 5 of HiC result file
HiC_Plot_Heatmap(file="toyHiC_frag15060_15069_Results.txt",index=c(1,2,5),
verbose=TRUE,sep="\t",header=TRUE,negative.log10.scale=FALSE,
xlab="Fragment Index",ylab="Fragment Index",
main="Observed Frequency",col=blue2red(100))

- For more details, please use the PDF manuscript HMRFBayesHiC.pdf or use R HMRFBayesHiC package help. To go to the package index help page, use the commands
help(package="HMRFBayesHiC")
File format
- The input Hi-C data file is a a text file, with 4 columns respectively as fragment 1 number, fragment 2 number, observed frequency and expected frequency. For example, the first several lines of "toyHiC_frag15060_15069.txt" are
frag1 frag2 observeCount AFC.expectCount
15060 15061 7 6.973011175
15060 15062 6 5.700193419
15060 15063 9 5.298813264
15060 15064 4 5.254237232
15060 15065 2 2.109115001
... - The output Hi-C peak probability file is a a text file, with 5 columns respectively as fragment 1 number, fragment 2 number, observed frequency, expected frequency and peak probability. For example, the first several lines of "toyHiC_frag15060_15069_Results.txt" are
Frag1 Frag2 ObservedCount ExpectedCount PeakProbability
15060 15061 7 6.973011175 0.3164
15060 15062 6 5.700193419 0.3204
15060 15063 9 5.298813264 0.5276
15060 15064 4 5.254237232 0.3634
15060 15065 2 2.109115001 0.412
... - The output Hi-C peak parameterfile is a a text file, with estimated parameters of theta, phi and psi outputted. For example, the texts of the file "toyHiC_frag15060_15069_Estimated_Parameters.txt" are
"theta.estimate" 0.428861945375608
"phi.estimate" 7.30031777913866
"psi.estimate" 0.133206034043979